aroon 7 old v 14/00image
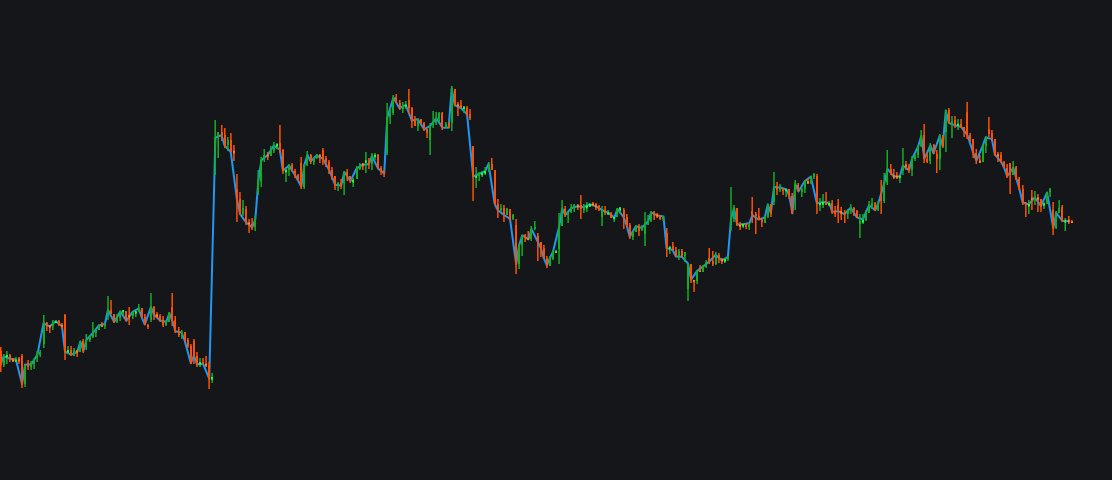
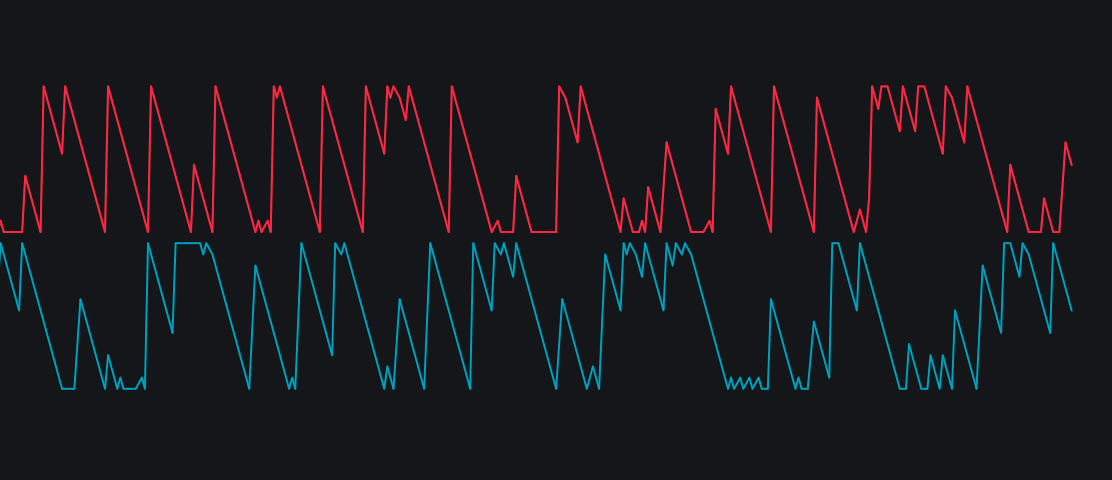
aroon 7 old v 14/00
The Aroon indicator is a technical analysis tool that identifies trend strength and potential reversals by measuring the time since the highest and lowest prices occurred within a specific period. Developed by Tushar Chande in 1995, it consists of two co…
/indicator/aroon-7-old-v-14-00-69
My Indimage
My Ind
# Copyright (c) 2025 @ikim1. All rights reserved. # This work is licensed under the MIT License. # For a copy, see . # indie:lang_version = 5 from indie import indicator @indicator('My Indie 1', overlay_main_pane=False) def Main(self): return self.close[…
/indicator/my-ind-69
bb for MPimage
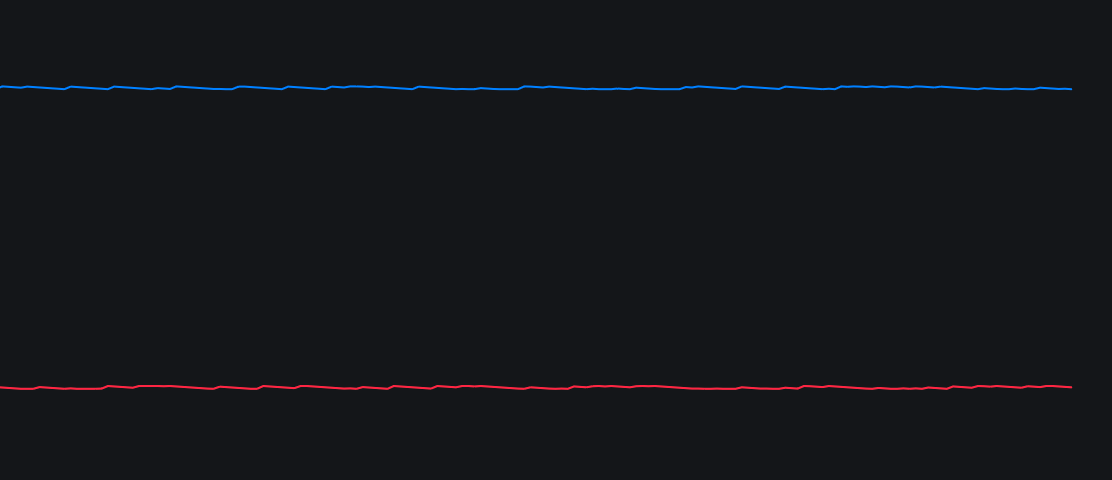
bb for MP
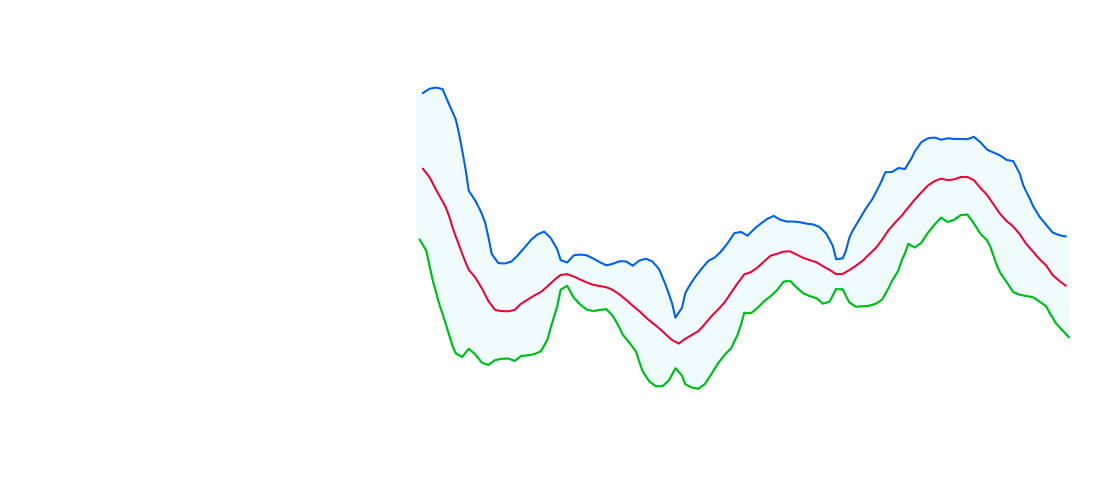
What Are Bollinger Bands? Bollinger Bands, a popular tool among investors and traders, help gauge the volatility of stocks and other securities to determine if they are over- or undervalued. Developed in the 1980s by financial analyst John Bollinger, the…
/indicator/bb-for-mp-45
Test indicator to publishimage
Test indicator to publish
my productmy product my productmy product my productmy product my productmy product my productmy product my productmy product my productmy product my productmy product my productmy product my productmy productmy product my productmy productmy product
/indicator/test-indicator-to-publish-22
Aroon v13 IDEimage
Aroon v13 IDE
The Aroon indicator is a technical analysis tool, developed by Tushar Chande in 1995, that measures a trend's strength and potential reversals using two lines, Aroon Up and Aroon Down. Aroon Up tracks the number of periods since the highest price, and Ar…
/indicator/aroon-v13-ide-49
Test_Ros_MCP_Indicator by Claude + 2 drawingsimage
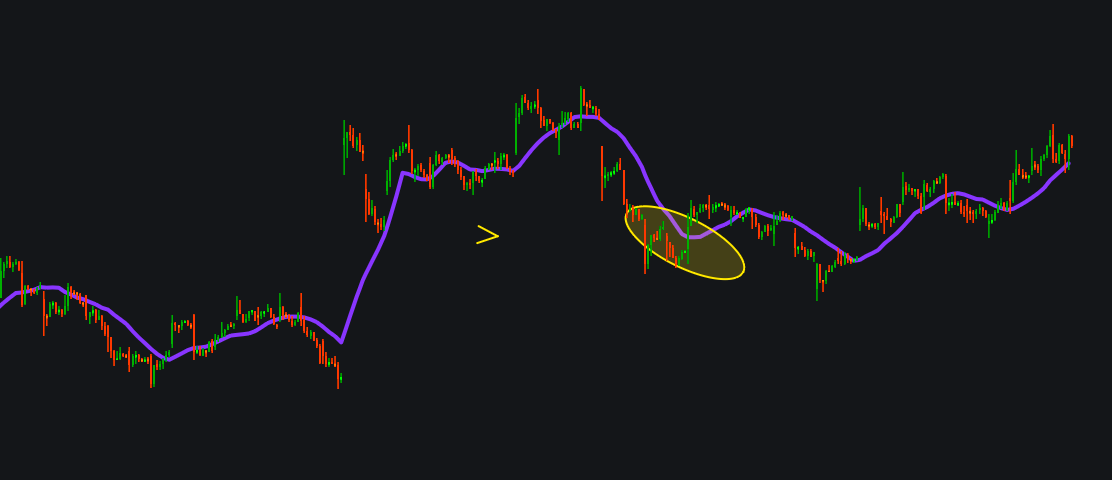
Test_Ros_MCP_Indicator by Claude + 2 drawings
This is a test Indicator created by Claude AI. MCP server connected to DEV was used.  There were several errors in the code, like. I need to fix the return type annotation for _collect_pivots. Since it returns a list of lists, I need to specify the exact…
/indicator/test-ros-mcp-indicator-by-claude-2-drawings-2