ikim's Cover image
markers (Copy)image
markers (Copy)
markers (Copy)markers (Copy)markers (Copy)markers (Copy)markers (Copy)markers (Copy)markers (Copy)markers (Copy)markers (Copy)markers (Copy)markers (Copy)markers (Copy)markers (Copy)markers (Copy)markers (Copy)markers (Copy)markers (Copy)markers (Copy)ma…
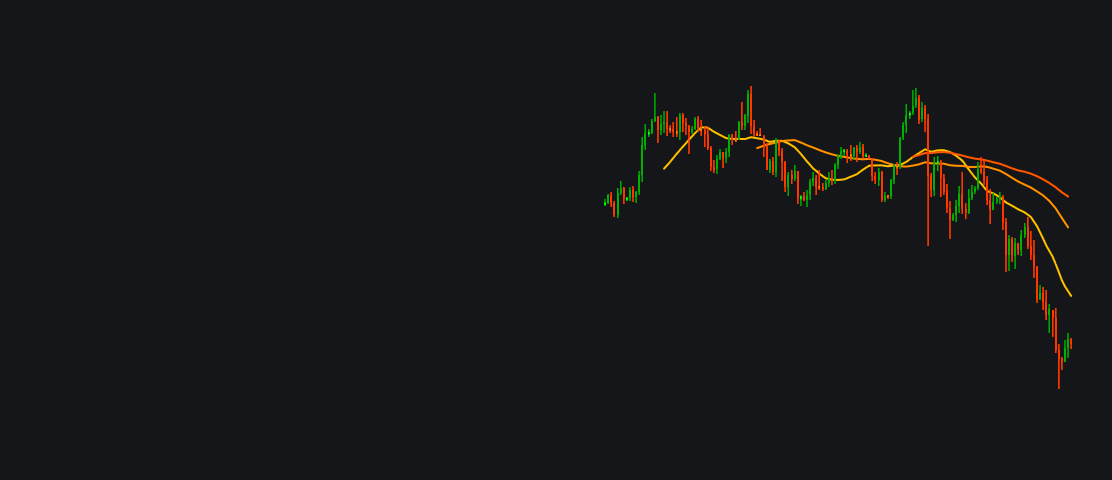
/indicator/markers-copy-46
MA ribbonimage
MA ribbon
My Custom Moving Average RibbonMy Custom Moving Average RibbonMy Custom Moving Average Ribbon My Custom Moving Average RibbonMy Custom Moving Average RibbonMy Custom Moving Average RibbonMy Custom Moving Average RibbonMy Custom Moving Average RibbonMy C…
/indicator/ma-ribbon-52
My Custom Pivot Points High/Lowimage
My Custom Pivot Points High/Low
Description Pivot Points (High/Low), also known as Bar Count Reversals, are used to anticipate potential price reversals. Pivot Point Highs are determined by the number of bars with lower highs on either side of a Pivot Point High. Pivot Point Lows are d…
/indicator/my-custom-pivot-points-high-low-64
BB just BBimage
BB just BB
Bollinger Bands, a popular tool among investors and traders, helps gauge the volatility of stocks and other securities to determine if they are over- or undervalued. Developed in the 1980s by financial analyst John Bollinger, the bands appear on stock ch…
/indicator/bb-just-bb-22
6299 chart demoimage
6299 chart demo
https://stage.takeprofit.team/chart/01KR3XAJT1DP8T0N296E0FBSMX?via=ikim
6299 chart demo
6243 by Ikimimage
6243 by Ikim
https://stage.takeprofit.team/chart/01KQCBS7BGV41SNVEWYBX9F9FZ?via=ikim
6243 by Ikim
6052 chart w/o bugs
https://stage.takeprofit.team/chart/01KP5MFFY7KP23M260K4PQ96VS?via=ikim
6052 chart w/o bugs